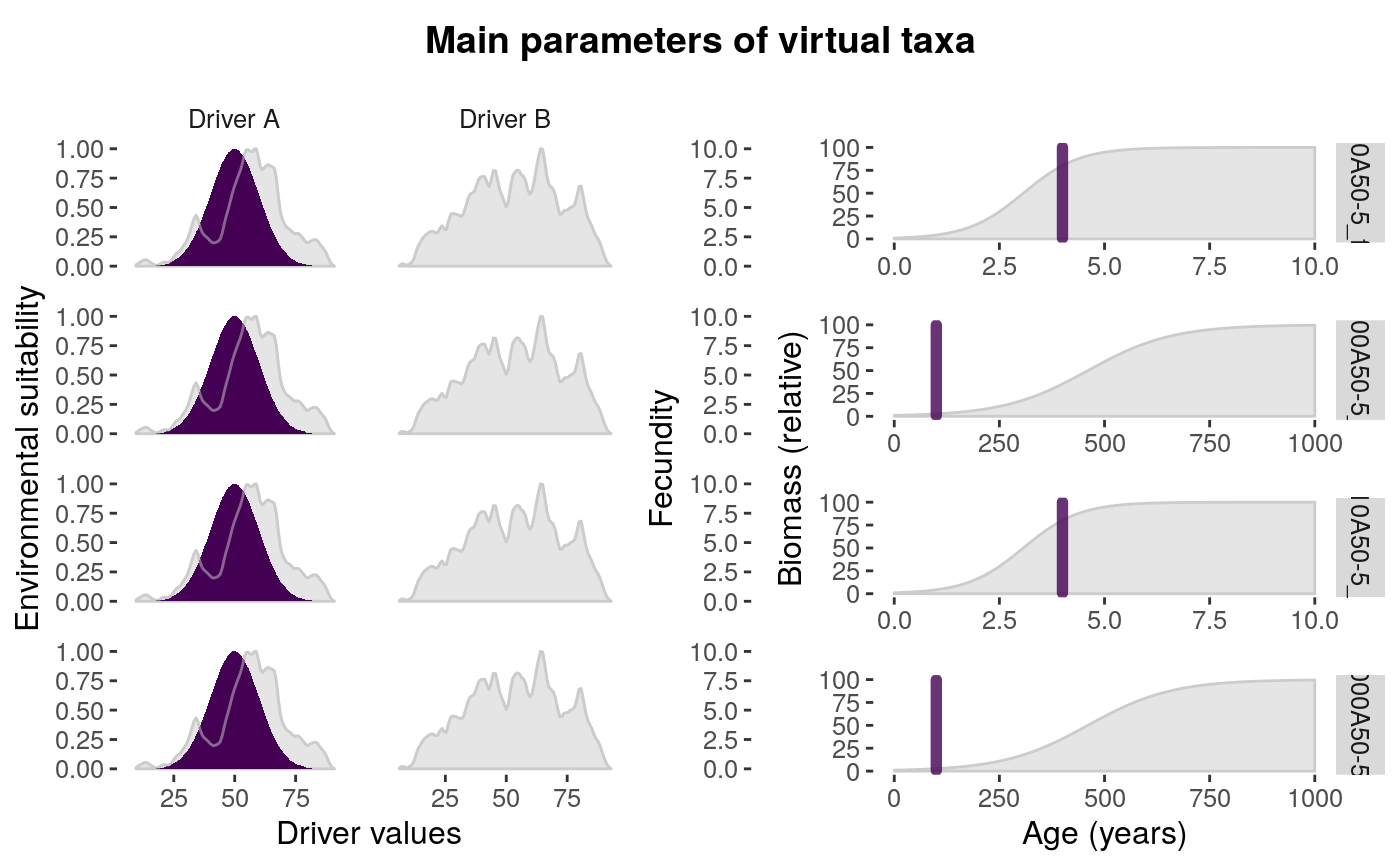
Plots the environmental niche, fecundity, growth curve, and maturity age, of each virtual taxa in a parameters dataframe for simulatePopulation, to help the user in making choices while adjusting them.
parametersCheck(
  parameters,
  species = "all",
  driver.A = NULL,
  driver.B = NULL,
  drivers = NULL,
  filename = NULL
  )
Arguments
| parameters | the parameters dataframe. |
|---|---|
| species | if "all" or "ALL", all species in "parameters" are plotted. It also accepts a vector of numbers representing the rows of the selected species, or a vector of names of the selected species. |
| driver.A | numeric vector with driver values. |
| driver.B | numeric vector with driver values. |
| drivers | dataframe with drivers |
| filename | character string, filename of the output pdf. |
Value
A ggplot2 object.
Details
The function prints the plot, can save it to a pdf file if filename is provided, and returns a ggplot2 object. Priority is given to drivers introduced through the drivers argument.
See also
Examples
#getting data
data(parameters)
data(drivers)

#plotting parameters
parametersCheck(
 parameters = parameters,
 drivers = drivers
 )