Simulates a virtual sediment accumulation rate.
Source:R/simulateAccumulationRate.R
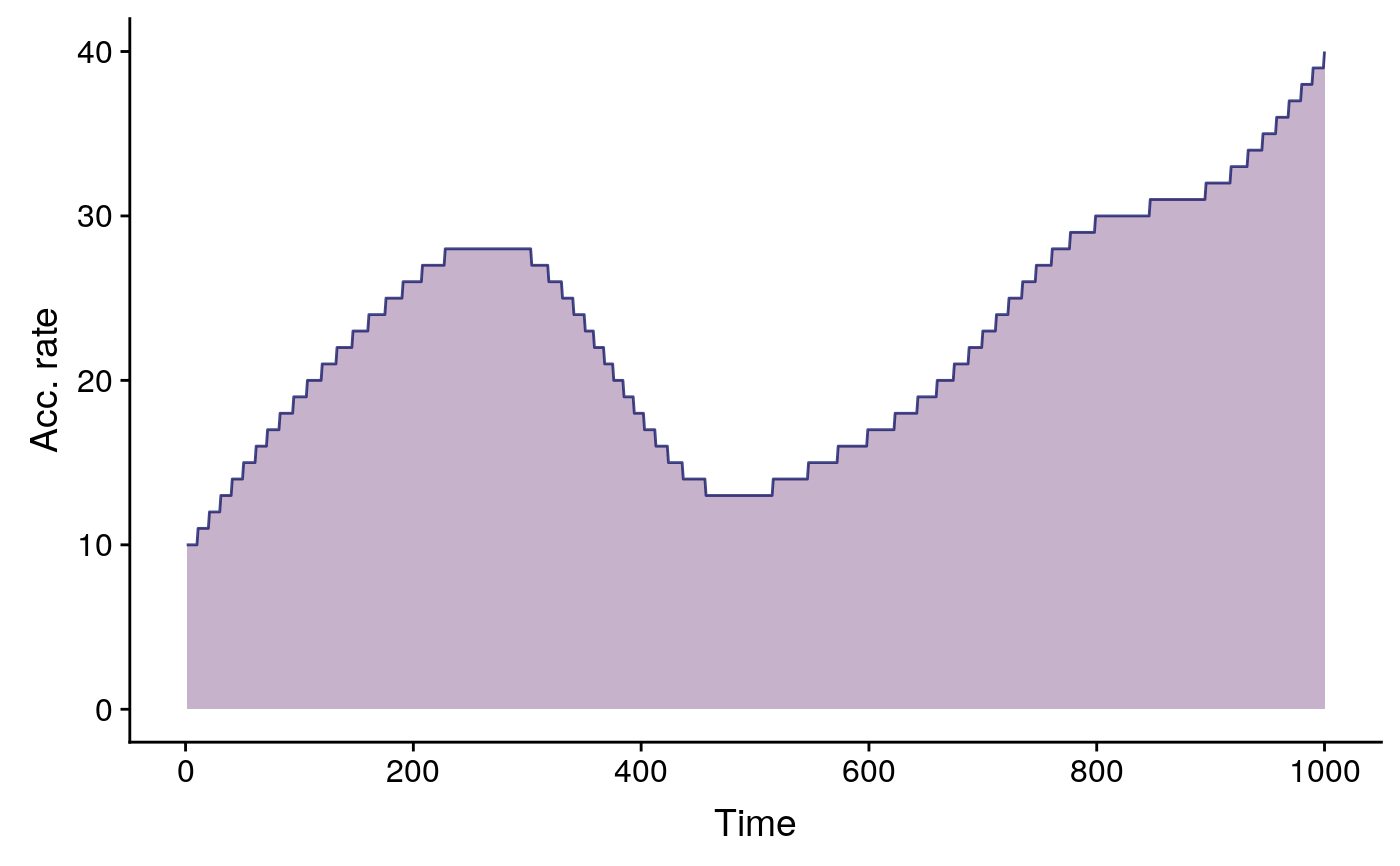
simulateAccumulationRate.RdGenerates a virtual sediment accumulation rate to be applied to the results of simulatePopulation.
simulateAccumulationRate(
  seed=50,
  time=1:1000,
  output.min=10,
  output.max=40,
  direction=1,
  plot=TRUE
  )
Arguments
| seed | integer, seed to be used by |
|---|---|
| time | vector of time values (ideally the same used to generate the simulations). Important: the |
| output.min | numeric, in years per centimetre, minimum sediment accumulation rate (10 by default). |
| output.max | numeric, in years per centimetre, maximum sediment accumulation rate (40 bu default). |
| direction | integer, values 1 or -1, to invert the resulting accumulation rate. |
| plot | boolean, plots output accumulation rate if |
Value
A dataframe like accumulationRate, with the following columns:
time: numeric, time or age of the given case.
accumulation.rate: numeric, in years per centimetre, simulated accumulation rate.
grouping: integer, grouping variable to aggregate together (with
aggregateSimulation) samples deposited in the same centimetre according accumulation.rate.
Details
The accumulation rate curve is generated through a random walk smoothed by a GAM model. The value of the seed argument changes the shape of the curve, but the user has no more control than trying different values to achieve a curve closer to the desired one. If plot is set to TRUE, the accumulation rate curve is printed on screen, but not exported to pdf.
See also
Examples
acc.rate <- simulateAccumulationRate( seed = 50, time = 1:1000, output.min = 10, output.max = 40, direction = 1, plot = TRUE )str(acc.rate)#> 'data.frame': 1000 obs. of 3 variables: #> $ time : int 1 2 3 4 5 6 7 8 9 10 ... #> $ accumulation.rate: num 10 10 10 10 10 10 10 10 10 10 ... #> $ grouping : num 1 1 1 1 1 1 1 1 1 1 ...