Moran's I test across multiple distance thresholds
Source:R/moran_multithreshold.R
moran_multithreshold.RdComputes Moran's I at multiple distance thresholds to assess spatial autocorrelation across different neighborhood scales. Identifies the distance threshold with the strongest spatial autocorrelation.
Usage
moran_multithreshold(
  x = NULL,
  distance.matrix = NULL,
  distance.thresholds = NULL,
  verbose = TRUE
)
Arguments
- x
Numeric vector to test for spatial autocorrelation. Typically model residuals or a response variable.
- distance.matrix
Numeric distance matrix between observations. Must have the same number of rows as the length of
x.- distance.thresholds
Numeric vector of distance thresholds defining different neighborhood scales. Each threshold specifies the maximum distance for spatial neighbors at that scale. Default:
NULL(automatically computed withdefault_distance_thresholds()).- verbose
Logical. If
TRUE, displays a plot of Moran's I values across distance thresholds. Default:TRUE.
Value
List with four elements:
per.distance: Data frame with one row per distance threshold, containing columns:distance.threshold: Distance threshold usedmoran.i: Observed Moran's I statisticmoran.i.null: Expected Moran's I under null hypothesisp.value: Two-tailed p-valueinterpretation: Text interpretation of the result
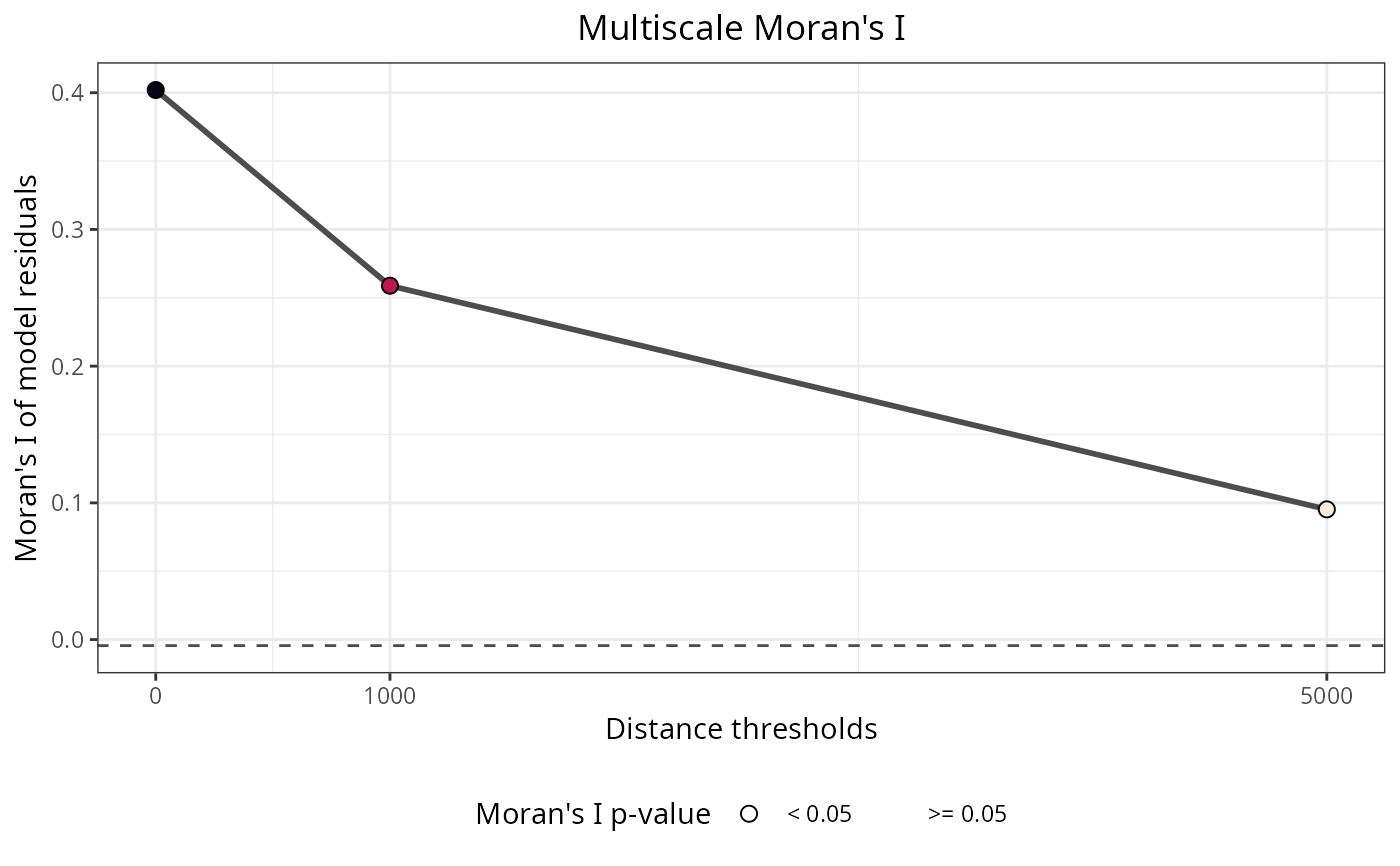
plot: ggplot object showing how Moran's I varies across distance thresholds, highlighting significant results.max.moran: Numeric value of the maximum Moran's I observed across all thresholds.max.moran.distance.threshold: Distance threshold (in distance matrix units) where Moran's I is maximized.
Details
This function applies moran() at multiple distance thresholds to explore spatial autocorrelation at different spatial scales. This multi-scale approach is valuable for several reasons:
Scale exploration: Different processes may operate at different spatial scales. Testing multiple thresholds reveals the scale(s) at which spatial autocorrelation is strongest.
Optimal neighborhood definition: Identifies the distance threshold that best captures the spatial structure in the data.
Uncertainty assessment: Spatial neighborhoods are often uncertain in ecological and spatial data. Testing multiple thresholds accounts for this uncertainty.
Interpreting results:
The plot shows Moran's I values across distance thresholds. Peaks in Moran's I indicate spatial scales where autocorrelation is strongest. The max.moran and max.moran.distance.threshold values identify the optimal scale. Significant results (p equal or lower than 0.05) indicate spatial autocorrelation at that particular scale.
This function is commonly used to:
Detect spatial autocorrelation in model residuals at multiple scales
Determine appropriate distance thresholds for generating spatial predictors with
mem_multithreshold()Assess whether spatial patterns vary across scales
See also
moran(), mem_multithreshold(), default_distance_thresholds(), get_moran()
Other spatial_analysis:
filter_spatial_predictors(),
mem(),
mem_multithreshold(),
moran(),
pca(),
pca_multithreshold(),
rank_spatial_predictors(),
residuals_diagnostics(),
residuals_test(),
select_spatial_predictors_recursive(),
select_spatial_predictors_sequential()
Examples
data(plants_df, plants_distance, plants_response)

# Test spatial autocorrelation at multiple distance thresholds
moran_multi <- moran_multithreshold(
  x = plants_df[[plants_response]],
  distance.matrix = plants_distance,
  distance.thresholds = c(0, 1000, 5000)
)


# View results for all thresholds
moran_multi$per.distance
#>   distance.threshold    moran.i moran.i.null p.value
#> 1                  0 0.40198062 -0.004424779       0
#> 2               1000 0.25884324 -0.004424779       0
#> 3               5000 0.09523306 -0.004424779       0
#>                 interpretation
#> 1 Positive spatial correlation
#> 2 Positive spatial correlation
#> 3 Positive spatial correlation

# Find optimal distance threshold
moran_multi$max.moran.distance.threshold
#> [1] 0
moran_multi$max.moran
#> [1] 0.4019806

# Plot shows spatial autocorrelation across scales
moran_multi$plot
# View results for all thresholds
moran_multi$per.distance
#> distance.threshold moran.i moran.i.null p.value
#> 1 0 0.40198062 -0.004424779 0
#> 2 1000 0.25884324 -0.004424779 0
#> 3 5000 0.09523306 -0.004424779 0
#> interpretation
#> 1 Positive spatial correlation
#> 2 Positive spatial correlation
#> 3 Positive spatial correlation
# Find optimal distance threshold
moran_multi$max.moran.distance.threshold
#> [1] 0
moran_multi$max.moran
#> [1] 0.4019806
# Plot shows spatial autocorrelation across scales
moran_multi$plot