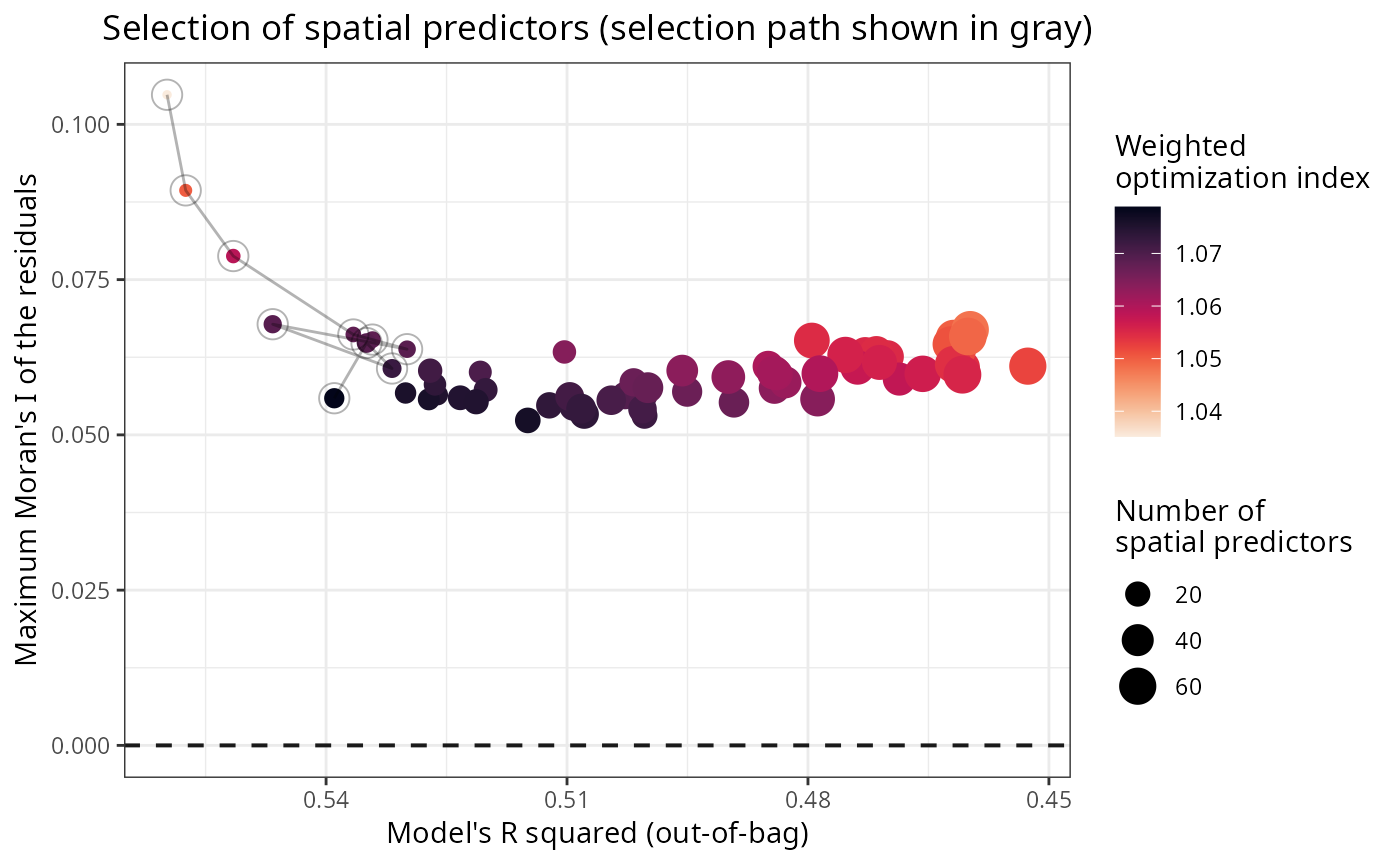
Optimization plot of a selection of spatial predictors
Source:R/plot_optimization.R
plot_optimization.RdPlots optimization data frames produced by select_spatial_predictors_sequential()
and select_spatial_predictors_recursive().
Usage
plot_optimization(
  model,
  point.color = viridis::viridis(
    100,
    option = "F",
    direction = -1
  ),
  verbose = TRUE
)
Arguments
- model
A model produced by
rf_spatial(), or an optimization data frame produced byselect_spatial_predictors_sequential()orselect_spatial_predictors_recursive().- point.color
Colors of the plotted points. Can be a single color name (e.g. "red4"), a character vector with hexadecimal codes (e.g. "#440154FF" "#21908CFF" "#FDE725FF"), or function generating a palette (e.g.
viridis::viridis(100)). Default:viridis::viridis(100, option = "F", direction = -1)- verbose
Logical, if
TRUEthe plot is printed. Default:TRUE
Details
The function returns NULL invisibly (without plotting) when:
The method used to fit a model with
rf_spatial()is "hengl" (no optimization required)No spatial predictors were selected during model fitting
The model is non-spatial
Examples
data(plants_rf_spatial)

plot_optimization(plants_rf_spatial)