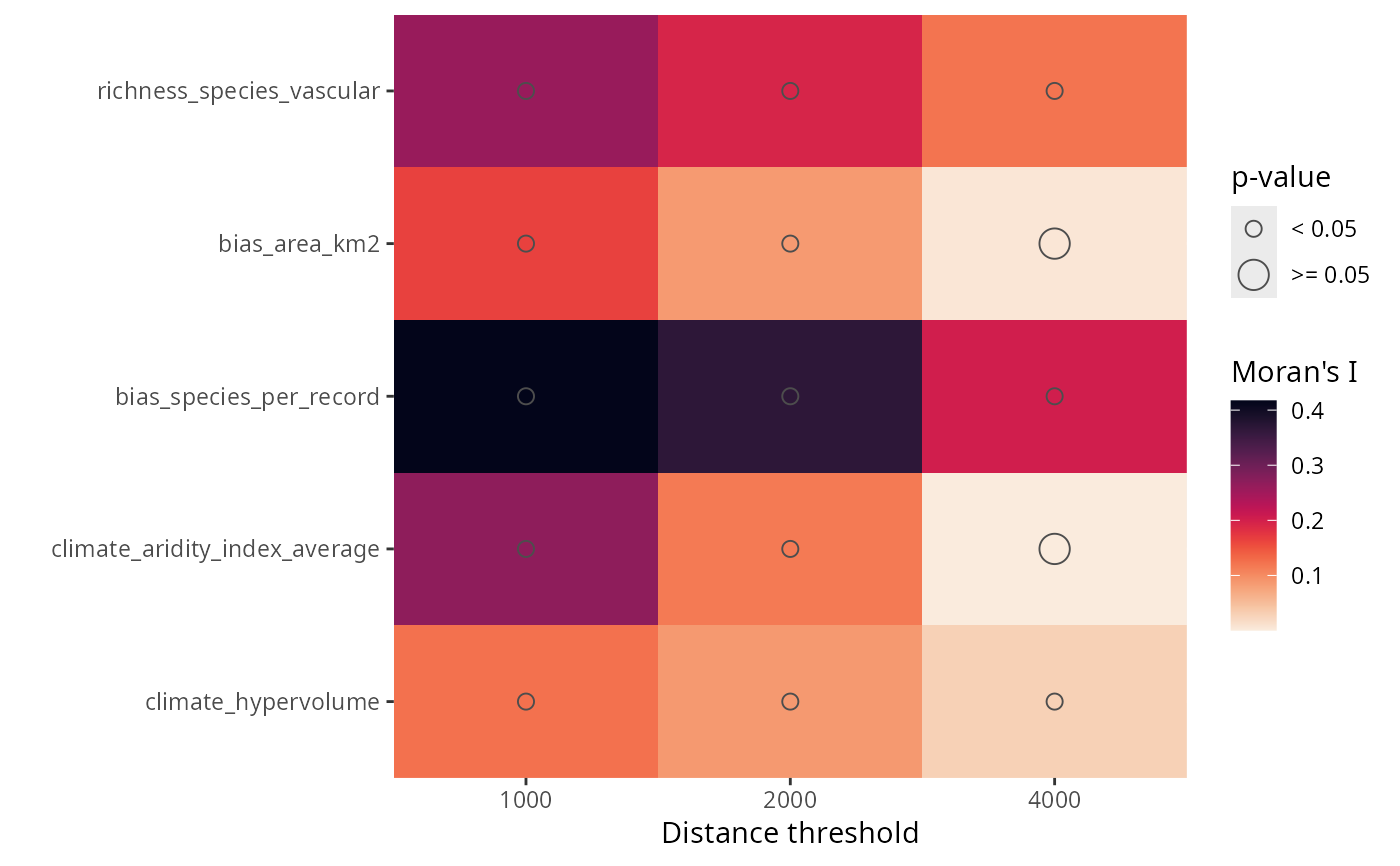
Moran's I plots of a training data frame
Source:R/plot_training_df_moran.R
plot_training_df_moran.RdPlots the the Moran's I test of the response and the predictors in a training data frame.
Usage
plot_training_df_moran(
  data = NULL,
  dependent.variable.name = NULL,
  predictor.variable.names = NULL,
  distance.matrix = NULL,
  distance.thresholds = NULL,
  fill.color = viridis::viridis(100, option = "F", direction = -1),
  point.color = "gray30"
)
Arguments
- data
Data frame with a response variable and a set of predictors. Default:
NULL- dependent.variable.name
Character string with the name of the response variable. Must be in the column names of
data. If the dependent variable is binary with values 1 and 0, the argumentcase.weightsofrangeris populated by the functioncase_weights(). Default:NULL- predictor.variable.names
Character vector with the names of the predictive variables. Every element of this vector must be in the column names of
data. Optionally, the result ofauto_cor()orauto_vif()Default:NULL- distance.matrix
Squared matrix with the distances among the records in
data. The number of rows ofdistance.matrixanddatamust be the same. If not provided, the computation of the Moran's I of the residuals is omitted. Default:NULL- distance.thresholds
Numeric vector, distances below each value are set to 0 on separated copies of the distance matrix for the computation of Moran's I at different neighborhood distances. If
NULL, it defaults toseq(0, max(distance.matrix)/4, length.out = 2). Default:NULL- fill.color
Character vector with hexadecimal codes (e.g. "#440154FF" "#21908CFF" "#FDE725FF"), or function generating a palette (e.g.
viridis::viridis(100)). Default:viridis::viridis(100, option = "F", direction = -1)- point.color
Character vector with a color name (e.g. "red4"). Default:
gray30