Computes temporal autocorrelation in a vector, and returns a dataframe for easy plotting.
Source:R/acfToDf.R
acfToDf.RdIt reads a vector representing a time series, applies acf for a given number of lags
acfToDf(
  x = NULL,
  lag.max = 100,
  length.out = 10
  )
Arguments
| x | numeric vector. Must represent a variable sampled at regular times. |
|---|---|
| lag.max | integer, number of lags over which to compute temporal autocorrelation. |
| length.out | integer, total number of lags to consider for plotting. Should be a subset of |
Value
A dataframe with the columns: #'
lag: numeric, lag in the time units of
xwith a maximum determined bylag.max, and a number of unique values determined bylength.outacf: Pearson correlation index returned by the
acffor a given number of lags for the given lag.ci.max: Maximum value of the confidence interval of
acf.ci.min: Minimum value of the confidence interval of
acf.
Details
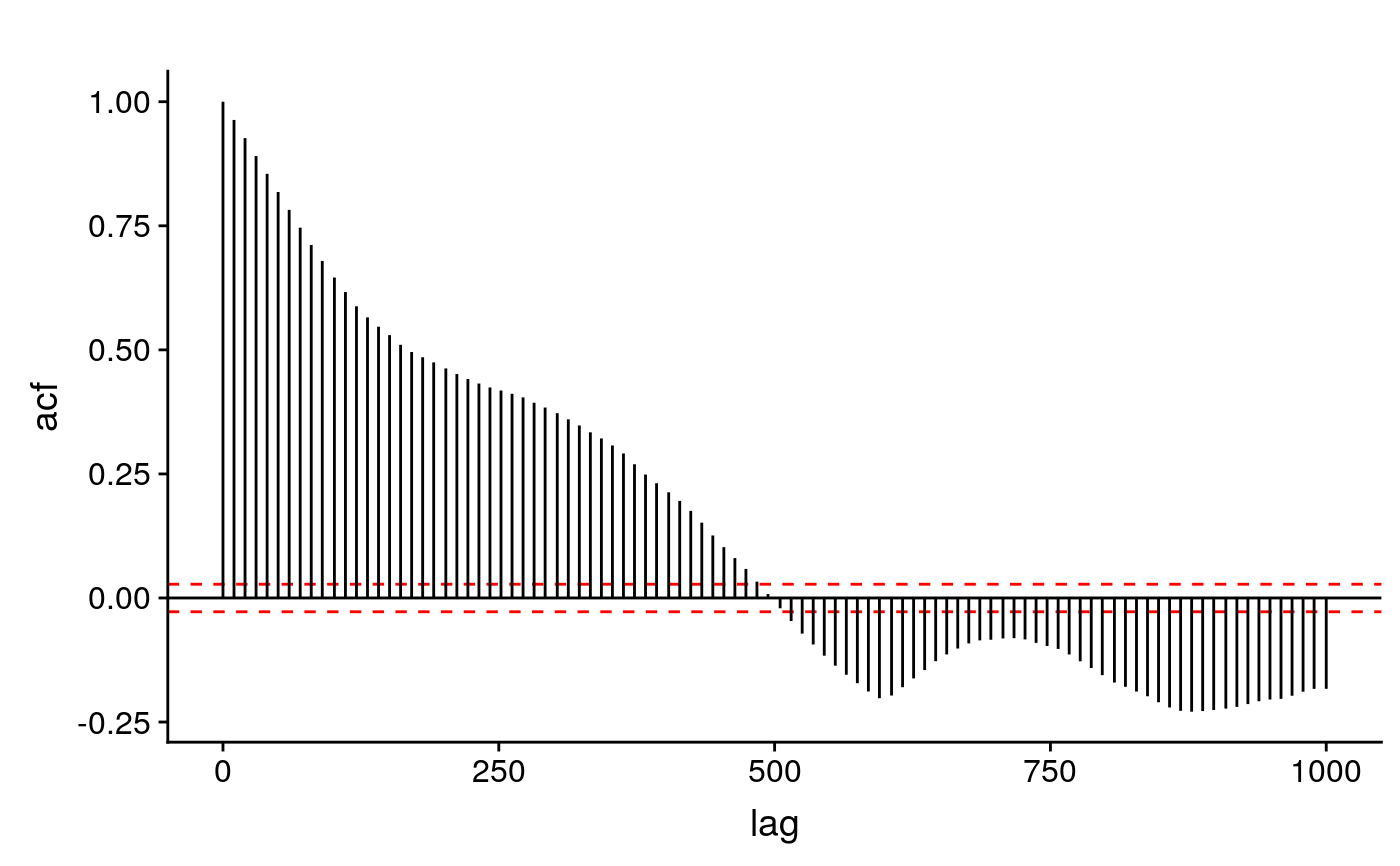
This function computes temporal autocorrelation of a given vector using acf, and returns a dataframe ready for easy plotting with plotAcf.
See also
Examples
#getting a driver data(driverA) #computing temporal autocorrelations x.df <- acfToDf( x = driverA, lag.max = 1000, length.out = 100 ) str(x.df)#> 'data.frame': 100 obs. of 4 variables: #> $ lag : num 0 10 20 30 40 50 60 70 80 90 ... #> $ acf : num 1 0.963 0.927 0.891 0.855 ... #> $ ci.max: num 0.0277 0.0277 0.0277 0.0277 0.0277 ... #> $ ci.min: num -0.0277 -0.0277 -0.0277 -0.0277 -0.0277 ...