plotAcf(
  x = NULL,
  plot.title = ""
  )
Arguments
| x | dataframe, output of |
|---|---|
| plot.title | string, title of the output plot. |
Value
A ggplot object
See also
Examples
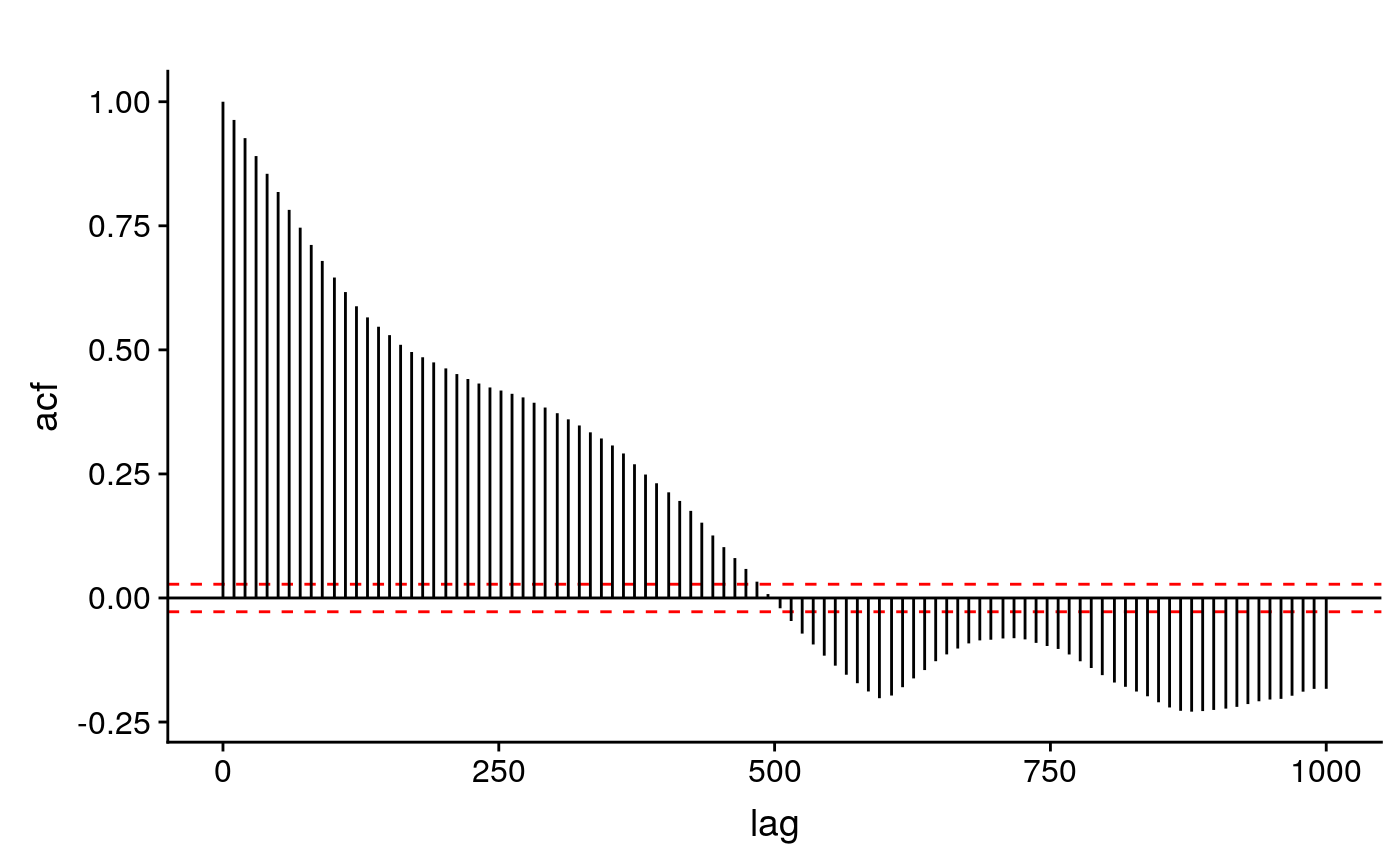
#getting a driver data(driverA) #computing temporal autocorrelations x.df <- acfToDf( x = driverA, lag.max = 1000, length.out = 100 ) str(x.df)#> 'data.frame': 100 obs. of 4 variables: #> $ lag : num 0 10 20 30 40 50 60 70 80 90 ... #> $ acf : num 1 0.963 0.927 0.891 0.855 ... #> $ ci.max: num 0.0277 0.0277 0.0277 0.0277 0.0277 ... #> $ ci.min: num -0.0277 -0.0277 -0.0277 -0.0277 -0.0277 ...#plotting output plotAcf(x.df)