Skip to contents

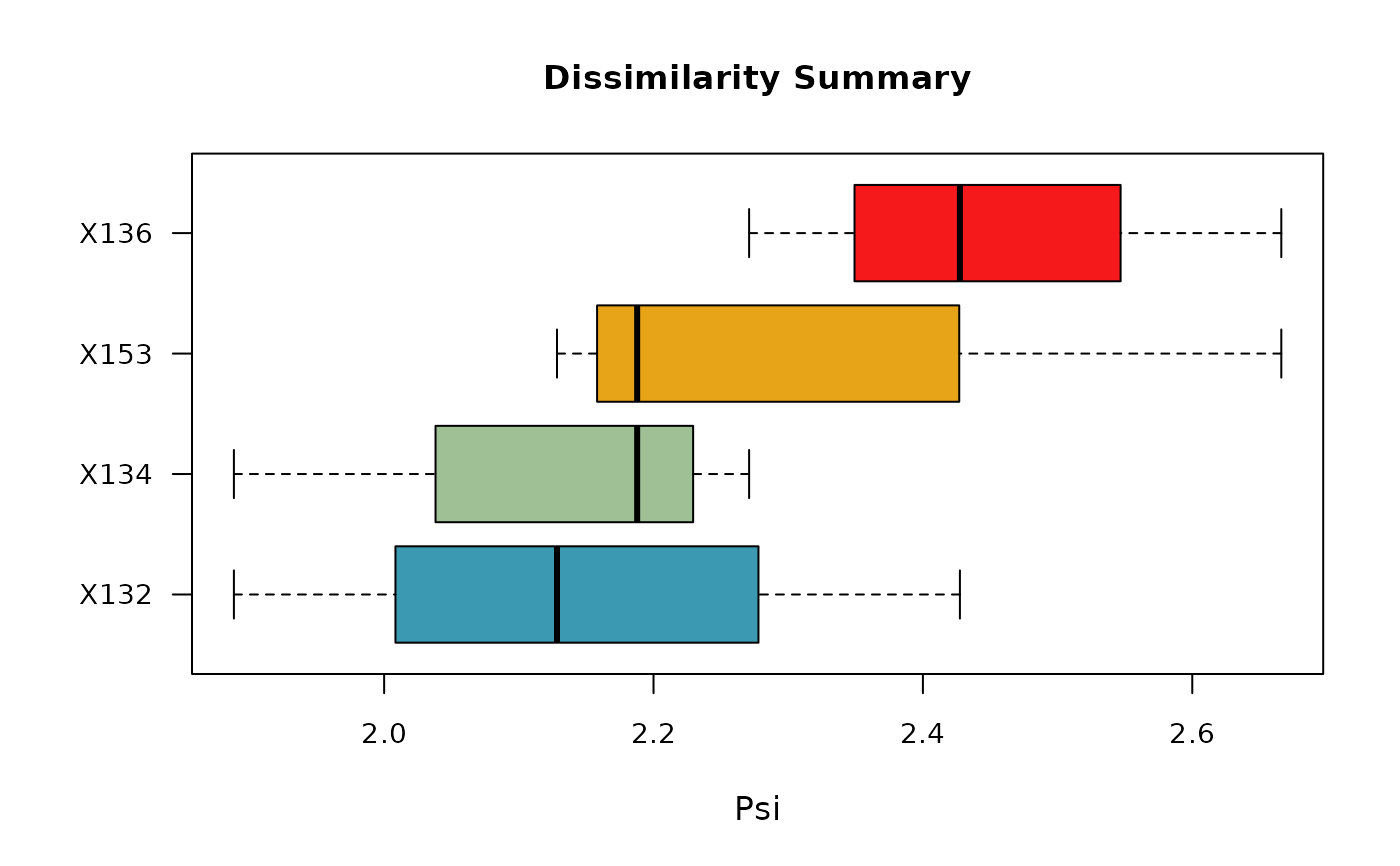
This function generates a visual summary of the dissimilarity or importance scores generated by the functions distantia() and distantia_importance().

  • distantia() data frame: plots the distribution of the Psi values of each time series against all others. This facilitates the identification of time series that are more or less similar to all others.

  • distantia_importance() data frame: plots the importance (contribution to similarity/dissimilarity) of each variable across all time series, facilitating the identification of variables making time series more or less similar.

In any case, if the argument df contains more than one combination of input parameters, then distantia_aggregate() is used to summarize dissimilarity scores across groups.

Usage

distantia_boxplot(df = NULL, color = NULL, f = median, ...)

Arguments

df

(required, data frame) output of distantia() or distantia_importance(). Default: NULL

color

(optional, character vector) boxplot fill color. Default: NULL

f

(optional, function) function used to arrange the boxes. Can be one of mean, median, min, max, or quantile. Default: median.

...

(optional, additional arguments to f). If f is quantile, probs = 0.75 can be used. Default: ...

Value

boxplot

Examples

#three time series
#climate and ndvi in Fagus sylvatica stands
#in Spain, Germany, and Sweden
#centerd and scaled with global parameters
tsl <- tsl_initialize(
  x = fagus_dynamics,
  name_column = "name",
  time_column = "time"
) |>
  tsl_transform(
    f = f_scale
  )

if(interactive()){
  tsl_plot(
    tsl = tsl,
    guide_columns = 3
    )
}

# example with distantia()
#-----------------------------------
distantia_df <- distantia(
  tsl = tsl
)

if(interactive()){
  boxplot_stats <- distantia_boxplot(
    df = distantia_df
    )
    boxplot_stats
}

#The boxplot identifies Spain
#as the site most dissimilar to all others,
#and Germany as the most similar to all others.


#example with distantia_importance()
#-----------------------------------
importance_df <- distantia_importance(
  tsl = tsl
)

if(interactive()){
  boxplot_stats <- distantia_boxplot(
    df = distantia_df
    )
}

#the boxplot identifies the variable evi
#(enhanced vegetation index) as the one
#contributing the most to site dissimilarity,
#and termpature as the variable contributing
#the most to site similarity.