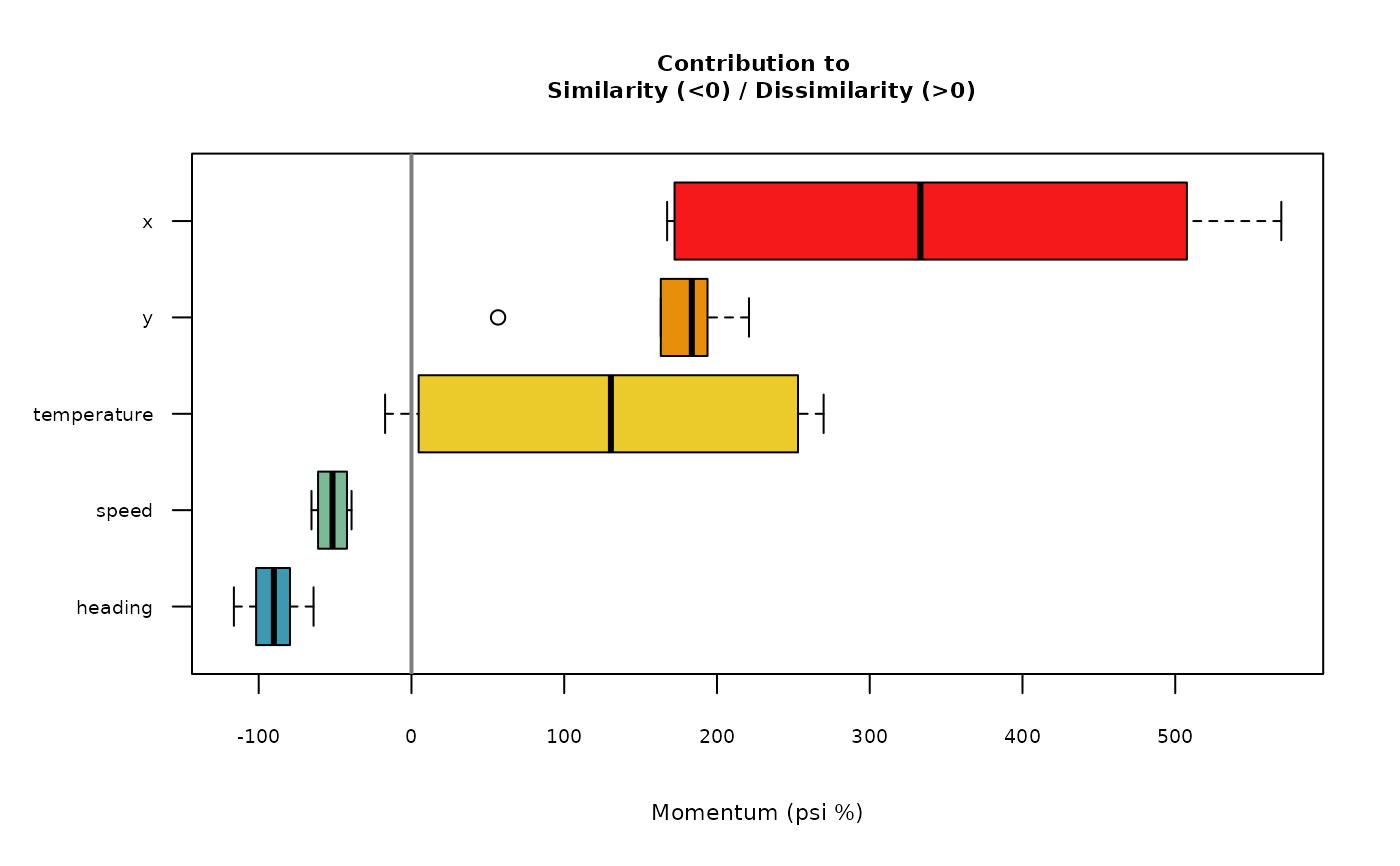
Creates a boxplot of a data frame returned by momentum(), summarizing the contribution to similarity (negative) and/or dissimilarity (positive) of individual variables across all time series.
Arguments
- df
(required, data frame) Output of
momentum(),momentum_ls(), ormomentum_dtw(). Default: NULL- fill_color
(optional, character vector) boxplot fill color. Default: NULL
- f
(optional, function) Function to summarize importance scores (for example,
mean) when there are several combinations of parameters indf. Ignored when there is a single combination of arguments in the input. Default:mean- text_cex
(optional, numeric) Multiplier of the text size. Default: 1
See also
Other momentum_support:
momentum_aggregate(),
momentum_model_frame(),
momentum_spatial(),
momentum_stats(),
momentum_to_wide()
Examples
tsl <- tsl_initialize(
  x = distantia::albatross,
  name_column = "name",
  time_column = "time"
) |>
  tsl_transform(
    f = f_scale_global
  )

df <- momentum(
  tsl = tsl,
  lock_step = TRUE
  )

momentum_boxplot(
  df = df
  )